Field Service Dashboards That Drive Decisions
Skip the paperwork and complexity—get instant access to the data that matters. Wello’s built-in dashboards deliver real-time insights tailored for field service teams, helping you make smart, fast, data-driven decisions.

Clear reporting for better decision-making.
Wello Business Intelligence Reports
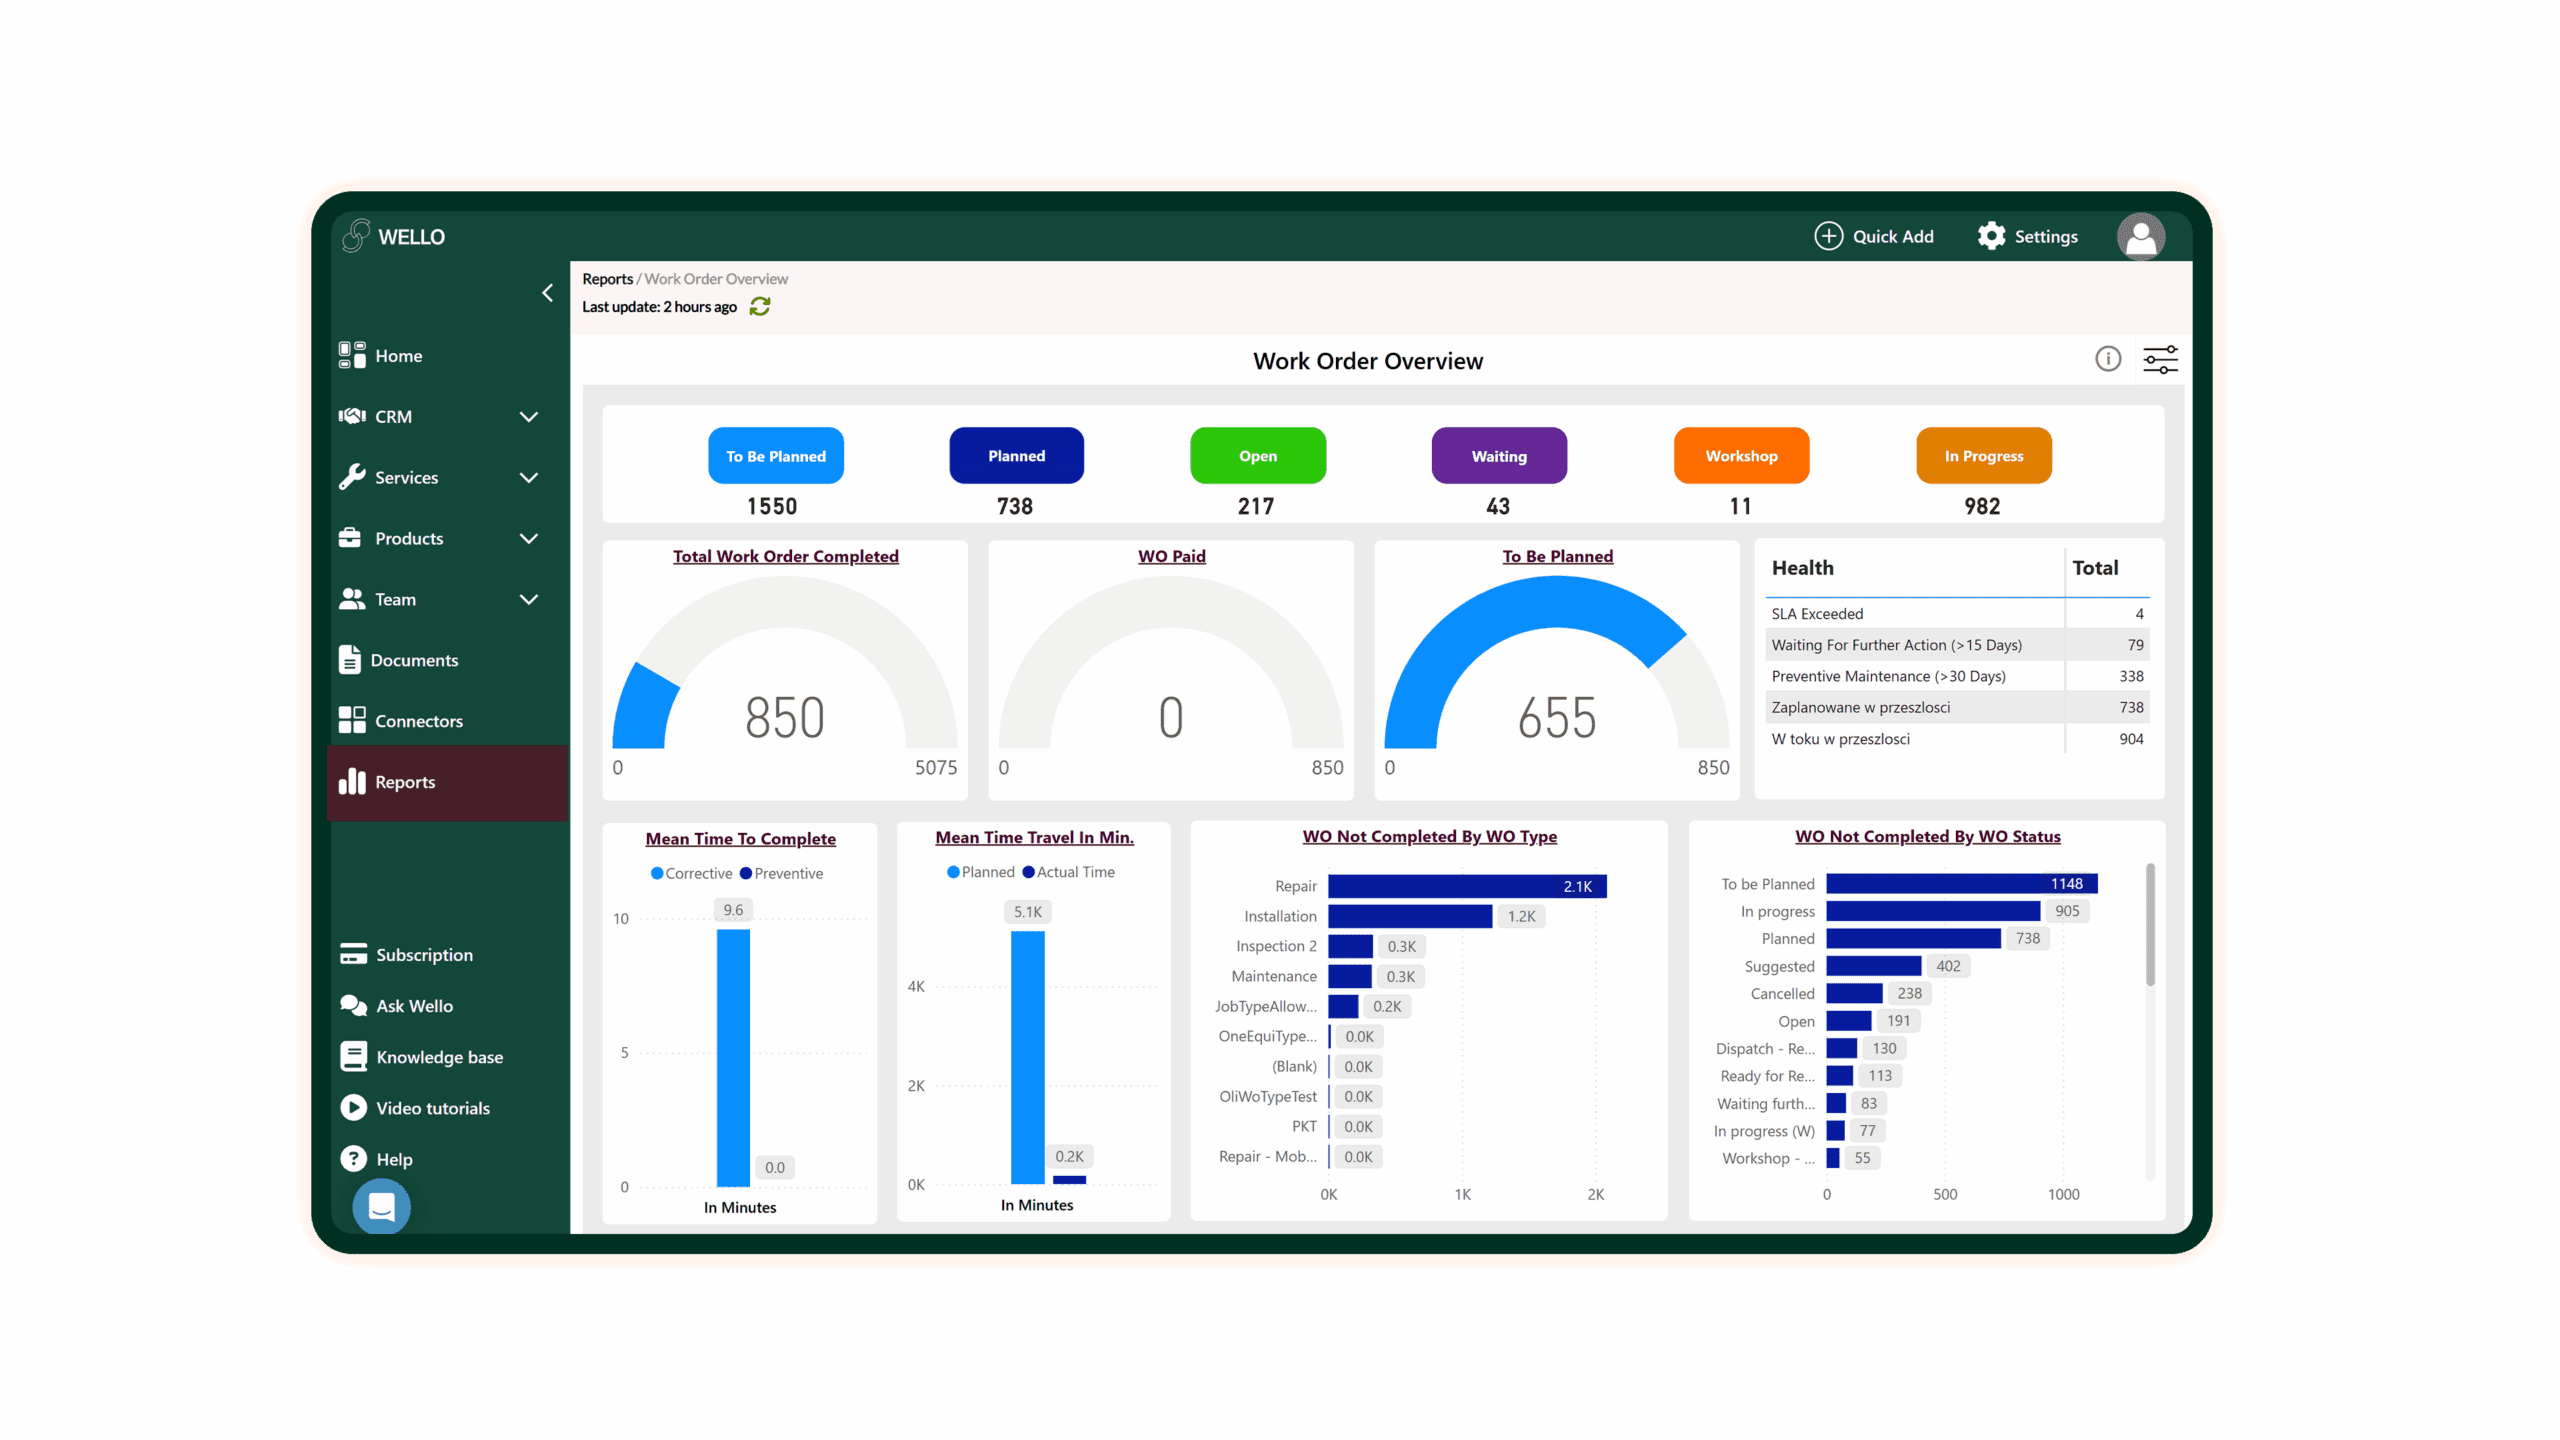
Wello’s Field Service Dashboards help you understand what’s happening across your operations—whether it’s tracking team performance, spotting delays, or managing equipment issues.
You can easily create reports, follow key metrics, and share updates without digging through spreadsheets. With everything in one place, it’s easier to catch problems early, keep your team aligned, and make informed decisions every day.
Seamless Integration. Smarter Insights.
Wello lets you connect your service software with other tools you already use—like CRM, inventory, and asset management systems—so all your data is in one place. This means you can see what’s happening across your business without switching between platforms.
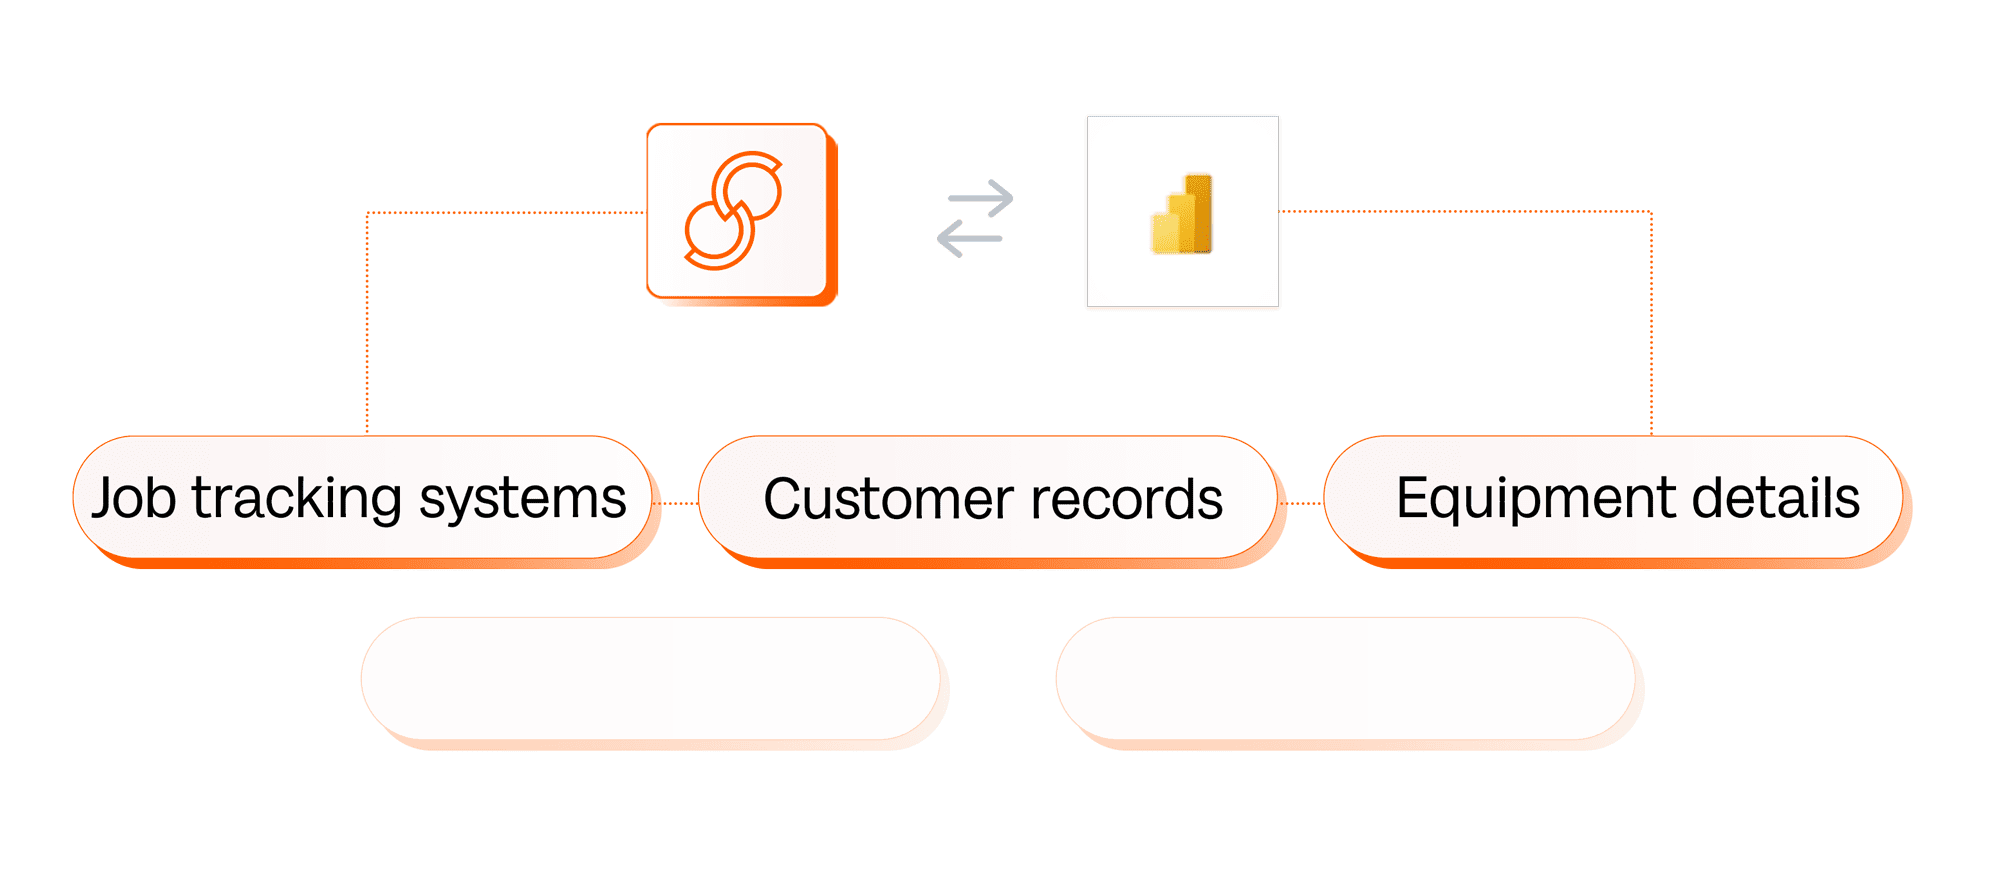
Your dashboards update automatically with the latest info, helping you track what matters—from job performance to stock levels and customer updates. You can access reports on any device, compare performance over time, and set alerts to spot issues early. It’s a simple way to stay informed and make better decisions across your team.
Clear and Useful Dashboards
Wello BI Reports are built to give you meaningful insights through easy-to-read dashboards. Each one helps you understand different parts of your business without needing technical skills.
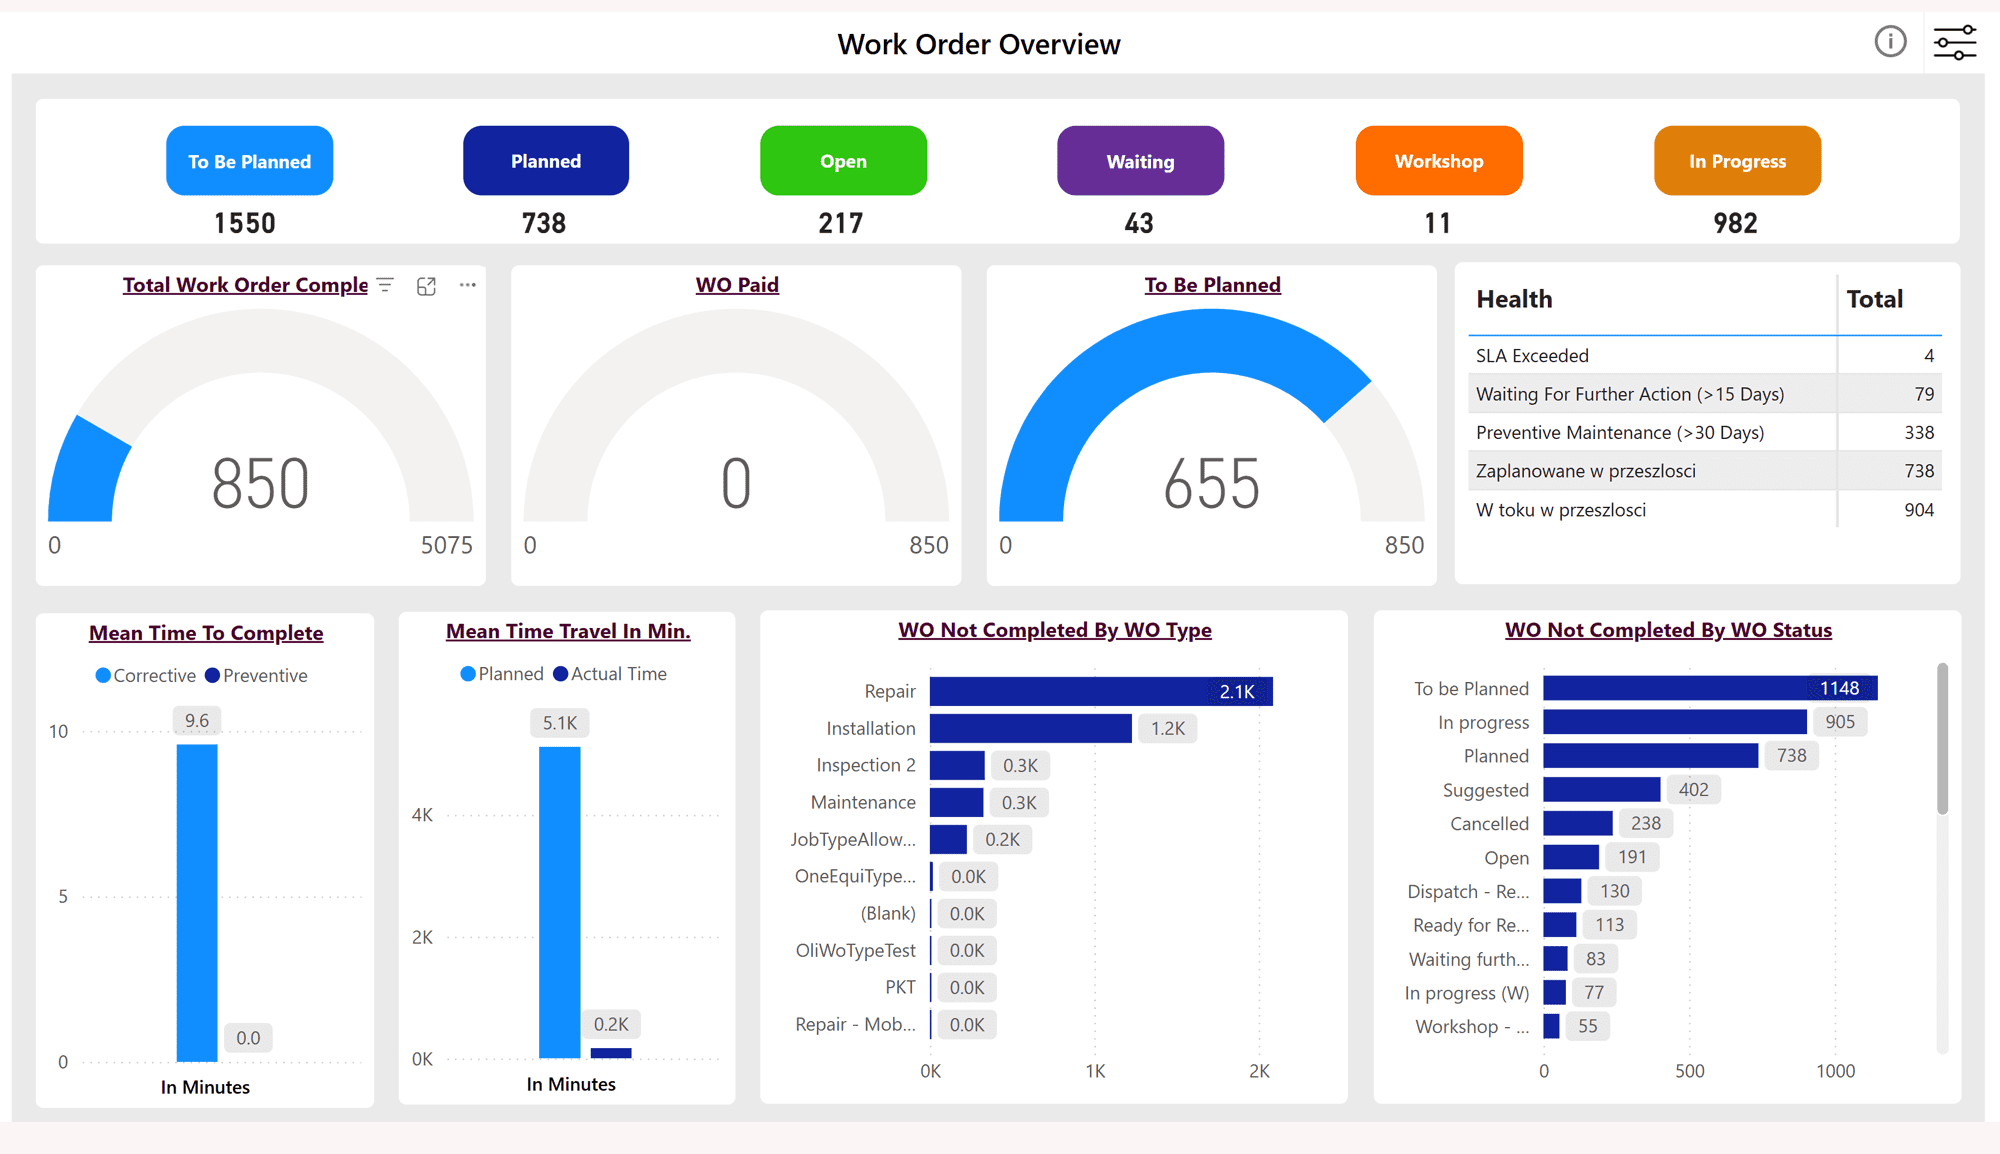
The Work Order Overview dashboard gives a real-time view of all work orders, showing which are pending, in progress, or delayed.
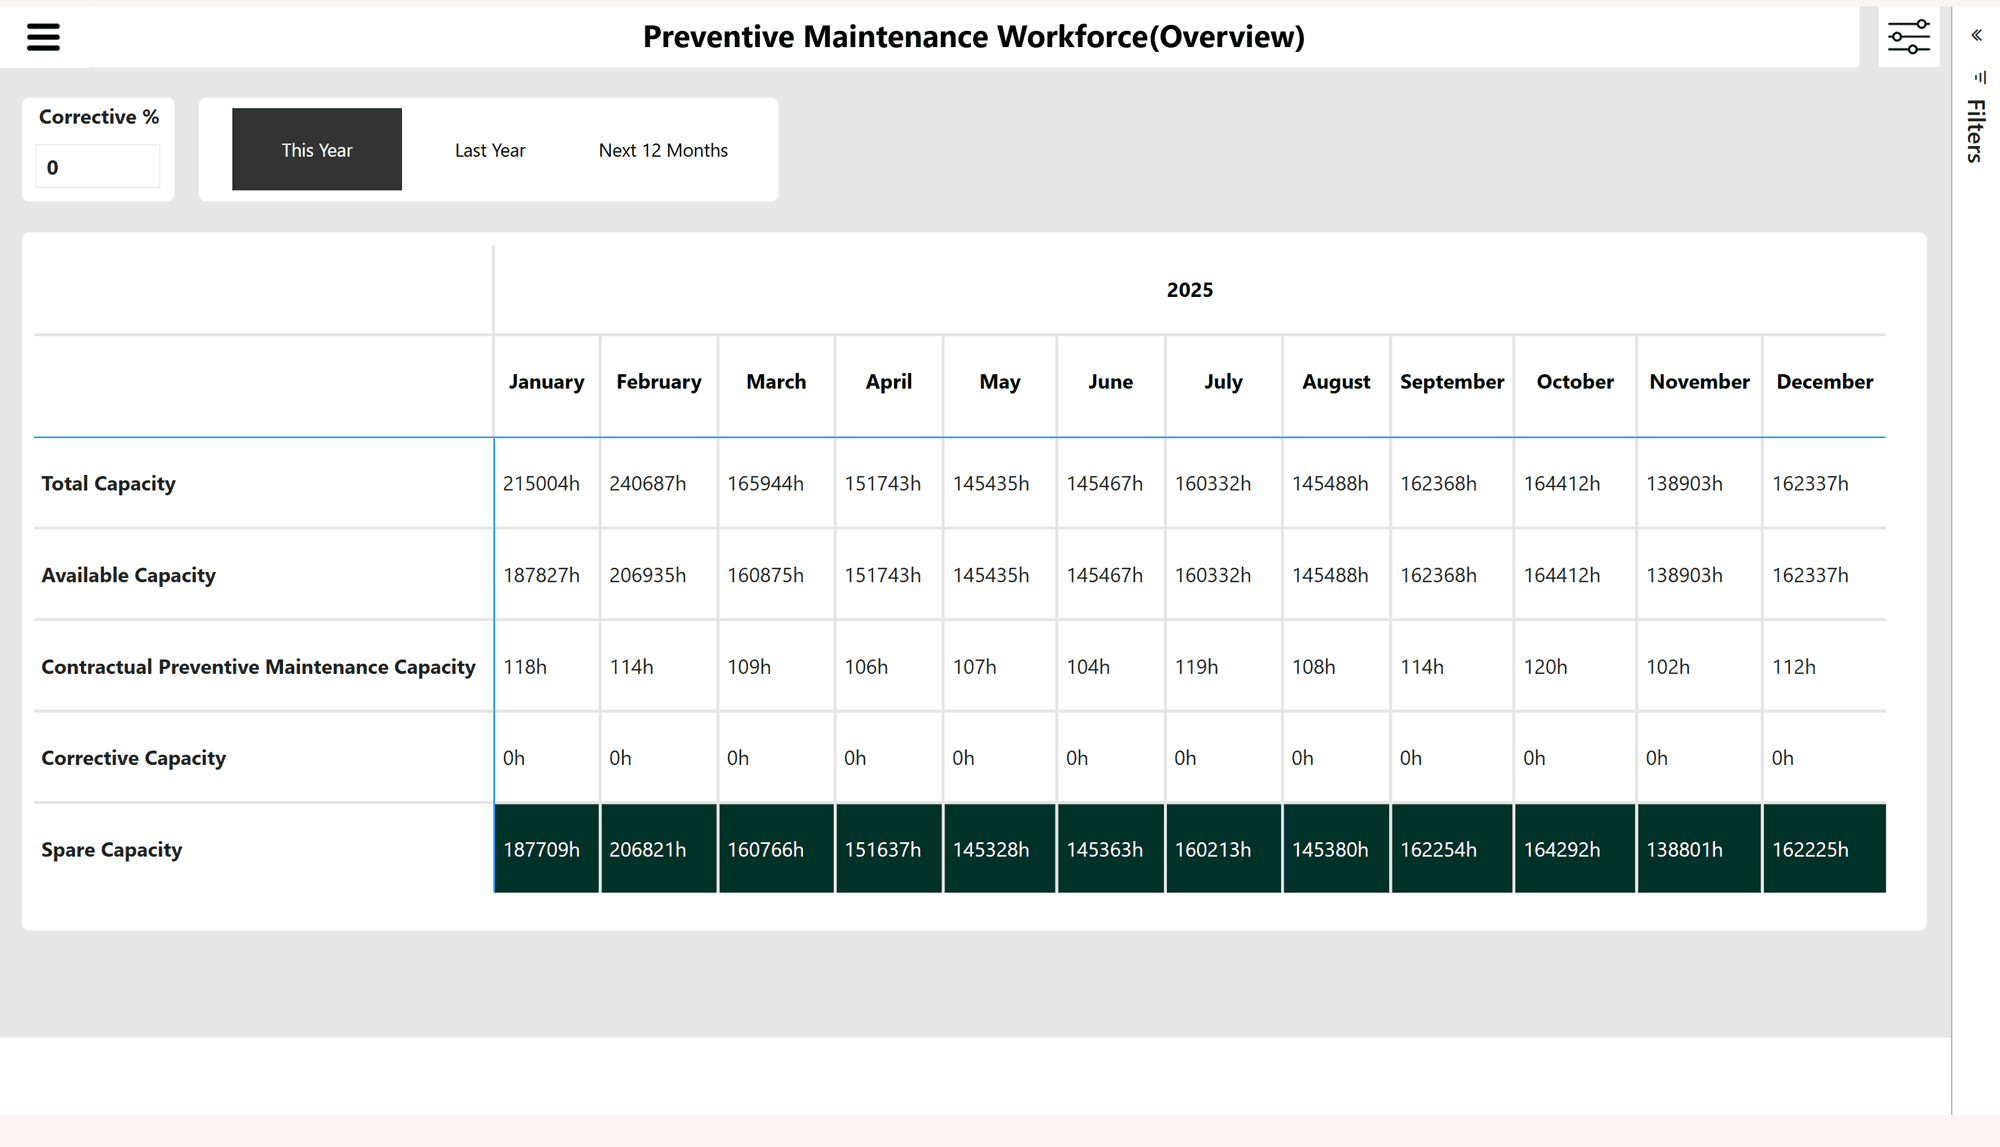
The Preventive Maintenance Workforce dashboard shows whether your team has enough capacity to handle maintenance jobs.
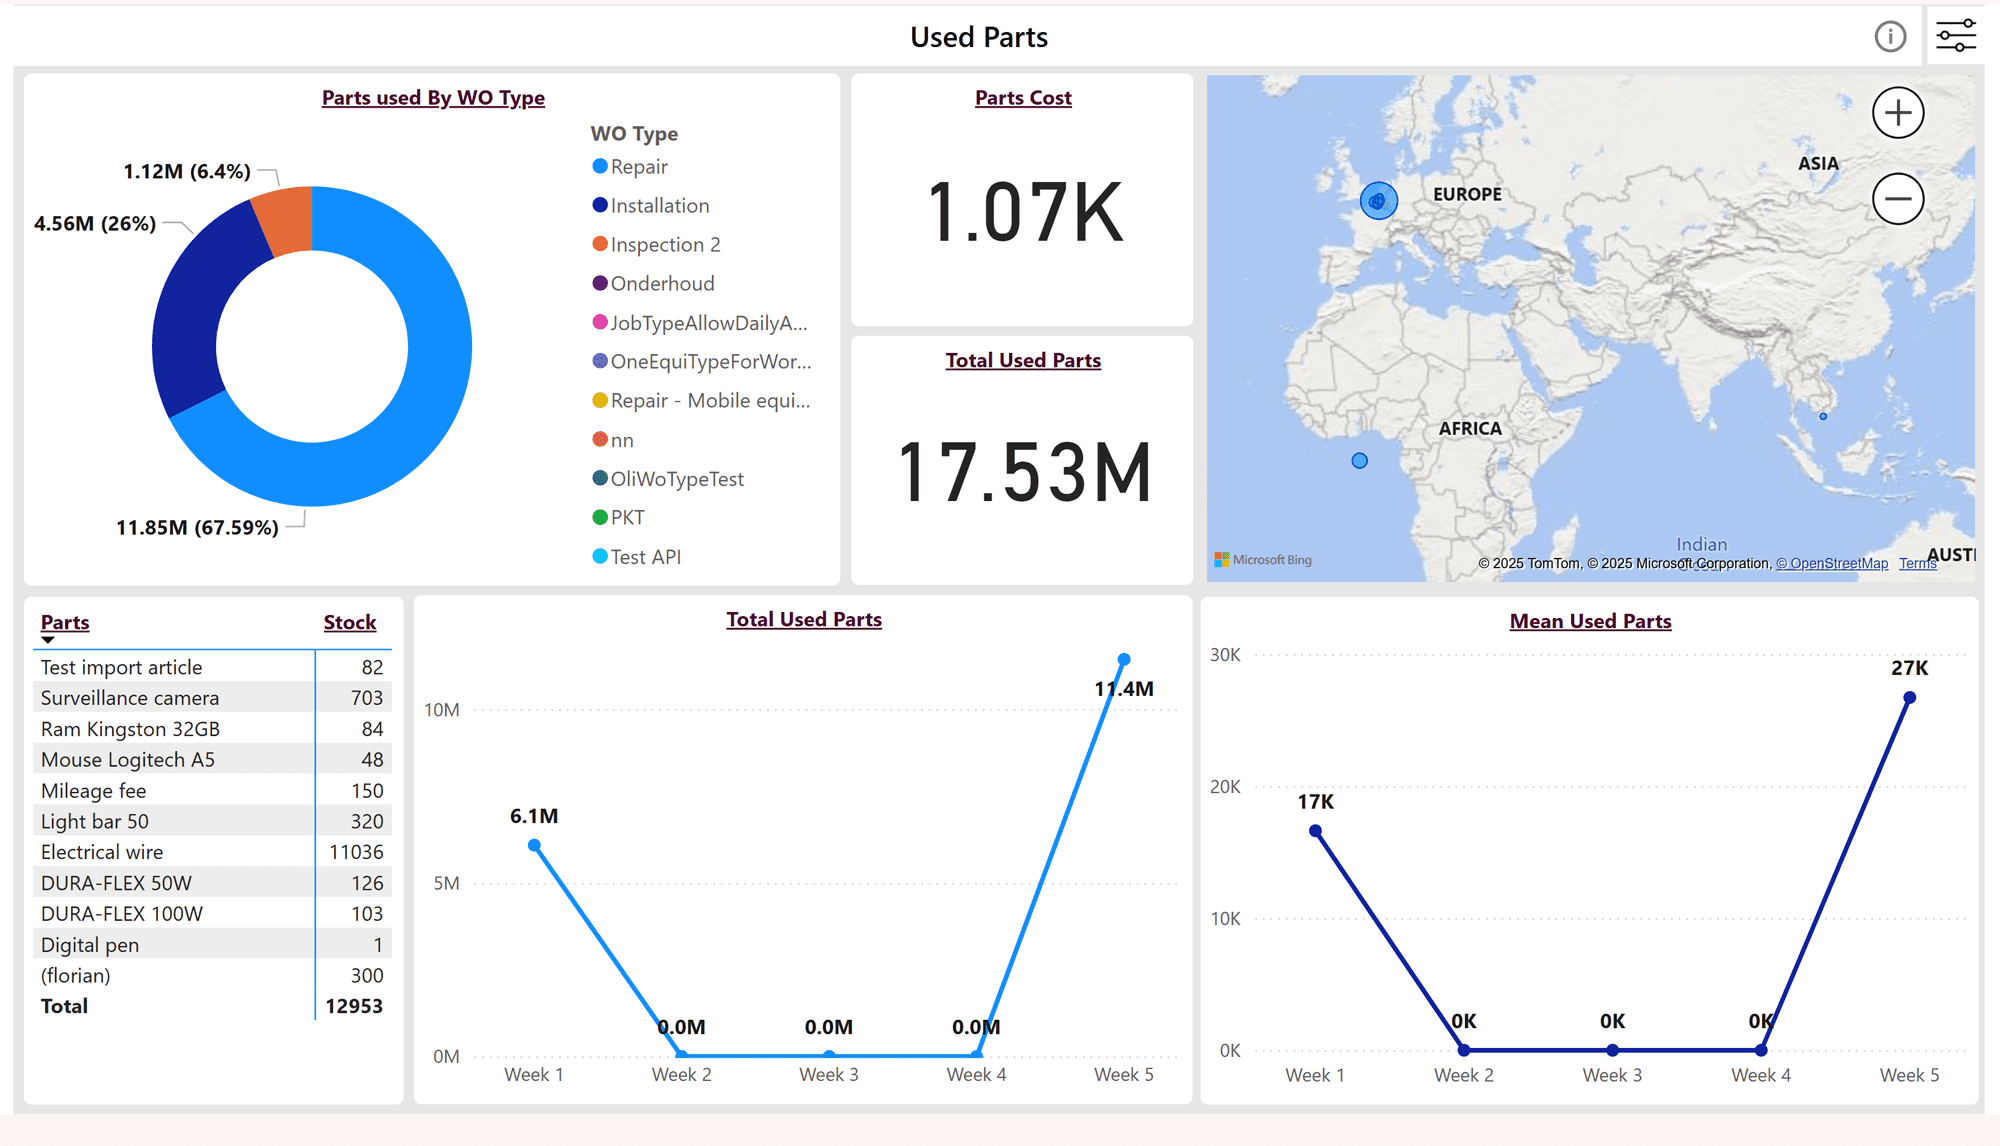
The Used Parts dashboard tracks which parts are used in service jobs and how much they cost.
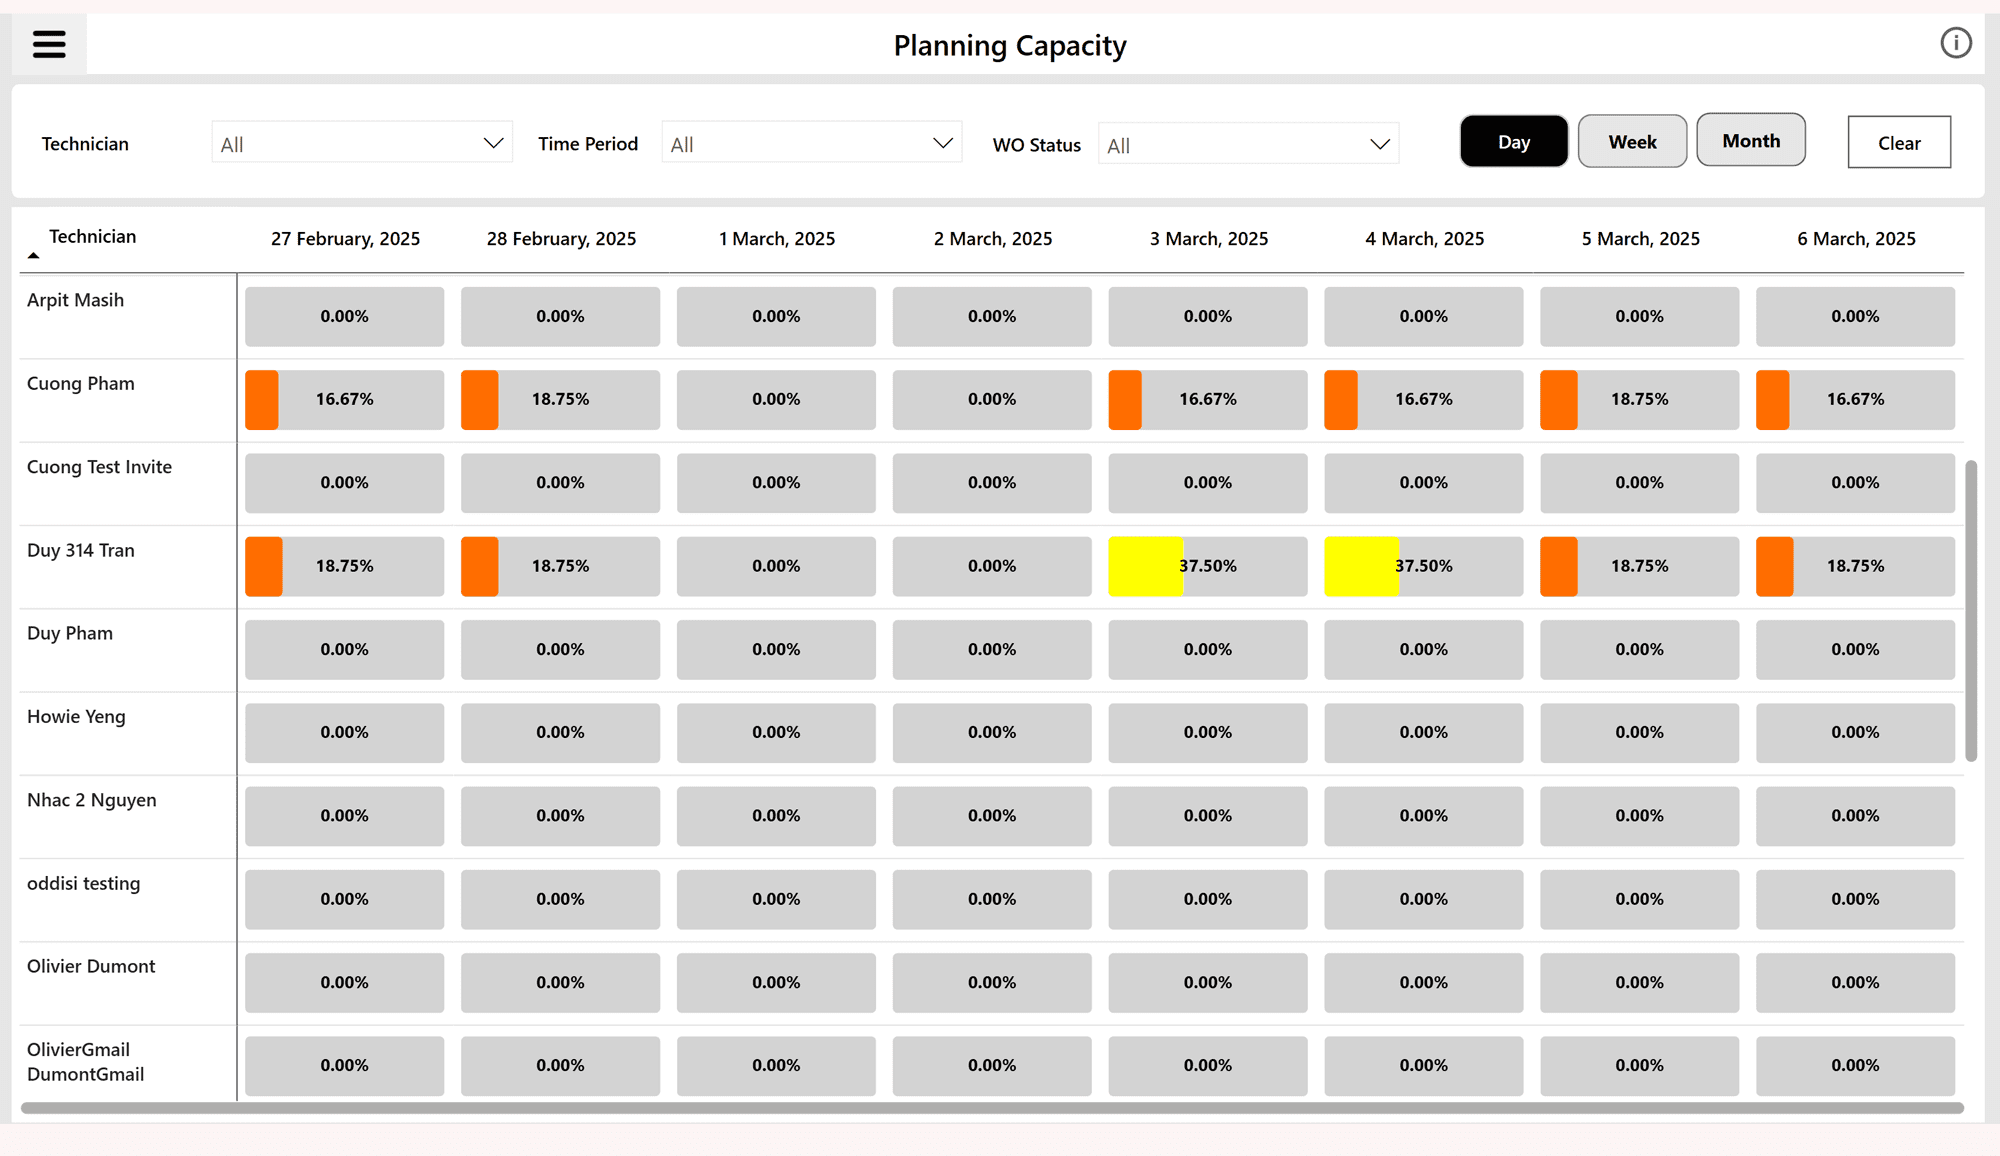
The Planning Capacity dashboard shows technician availability and workload.
Better Customer & Equipment Insights
Today, service departments collect a lot of data—but it’s only useful if you can actually see and understand it. Imagine being able to access your key stats anytime, from any device, in a clear and simple dashboard.
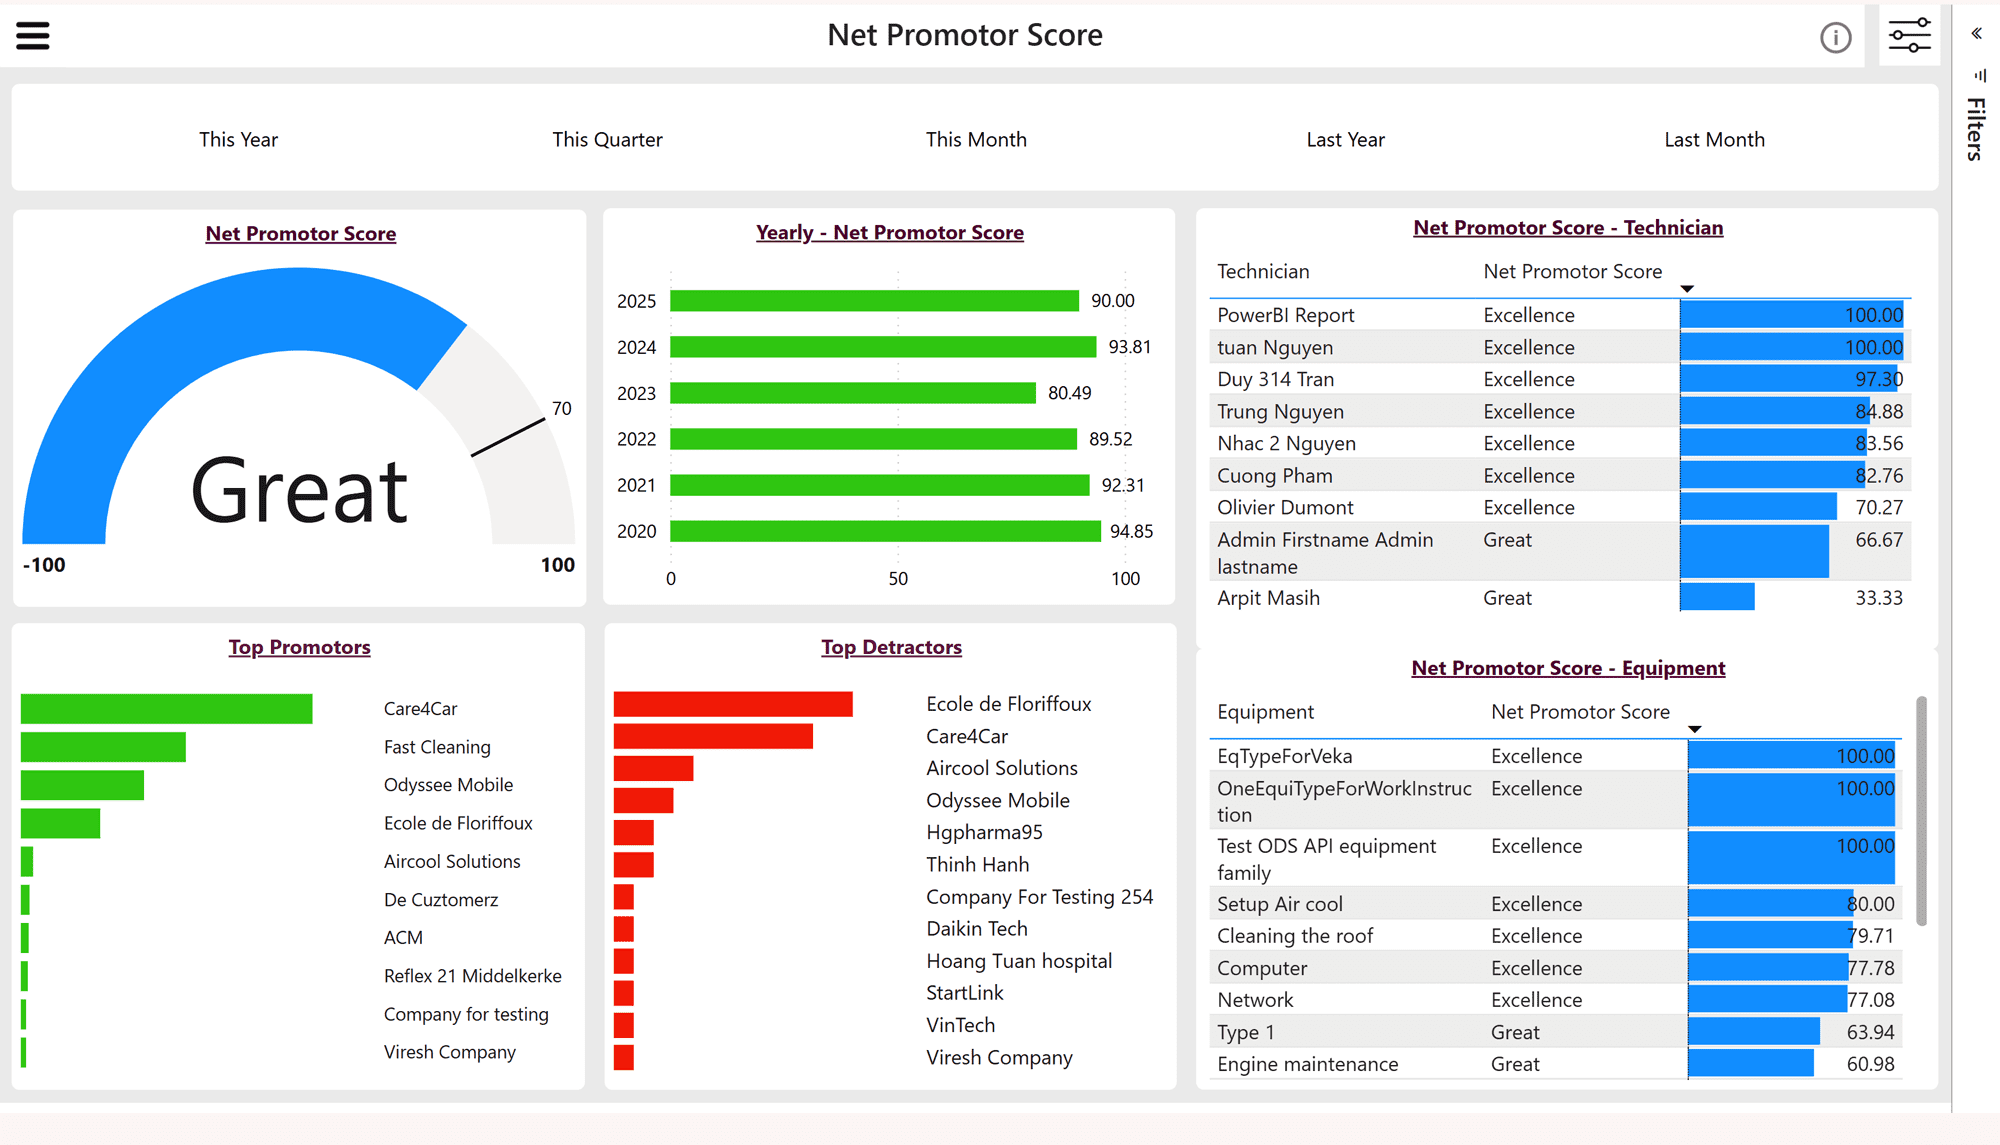
Monitors customer feedback and technician performance. Businesses can use this information to improve service and build stronger customer relationships.
The SLA Analysis dashboard shows response times, resolution rates, and whether service agreements are being met. This helps service teams improve response times and meet commitments.
The Equipment dashboard keeps track of all customer equipment, including warranty status and maintenance history. This helps businesses stay organized and plan future maintenance needs.
The Maintenance dashboard helps businesses monitor the condition of equipment and schedule maintenance when needed. This reduces downtime and keeps equipment running smoothly.
Helping Businesses
Make Better Decisions
When you turn this data into reports you can trust, you’ll start to spot issues, track progress, and make better decisions across your team. It’s much harder to grow a business without these basics in place.
For field service teams
These reports make scheduling easier and improve service quality.

For finance teams
They provide clear financial reports and cost tracking.

For customer service teams
They help improve response times and customer interactions.
Regular Dashboard Updates
to Keep You Ahead
Wello BI Reports is always improving, with new dashboards and better analytics added regularly to give you clearer, more useful insights. We also offer custom dashboards built specifically for your business—only visible to your team—so you can track the metrics that matter most.
Start now to benefit from real-time data and stay ready for everything that’s coming next.
Get access of Wello BI Reports Today
At Wello, we focus on giving each user the tools they need to monitor, measure, and improve their work. You can connect to other systems, access reports on the go, build dashboards in minutes, and get alerts when something important changes—so you’re always in control, and never in the dark.


